Advanced metering infrastructure (AMI) is an integrated system of smart meters, communications networks, and data management systems that enables two-way communication between utilities and customers. Customer systems include in-home displays, home area networks, energy management systems, and other customer-side-of-the-meter equipment that enable smart grid functions in homes, offices, and factories. Time-based rate programs include different types of electricity pricing options for customers that are made possible by AMI and sometimes include customer systems.
AMI and customer system projects funded through the Recovery Act Smart Grid Investment Grant (SGIG) program reported data for the following:
- Smart Meters Deployed >>
- AMI Expenditures >>
- Customer Devices Deployed >>
- Customer System Asset Expenditures >>
- Enrollment in Time-Based Rate Programs >>
Smart Meters Deployed
The chart below shows the number of smart meters funded through the Smart Grid Investment Grant (SGIG) program that are installed and operational. The cumulative estimated number of smart meters, shown as the green line below, is the total number of meters that were expected to be installed by the completion of the SGIG program and was based on the project plans of the SGIG recipients installing smart meters. Coverage is the percentage of smart meter installations resulting from SGIG funding and is calculated based on the total number of meters in the United States as reported by the U.S. Energy Information Administration (EIA) in the 2009 Electric Power Annual Report, Table 7.1.
The number of meters installed was based on quarterly build metrics reports submitted by SGIG recipients to the Data Hub. To be included in these reports, meters must have been installed and operational, meaning that each meter was physically placed and configured in a manner that enabled it to perform its primary function of recording customer electricity usage and transmitting that information through a communication system to the utility.
SGIG Smart Meters Installed and Operational
Deployed as of March 31, 2015
in Millions of Smart Meters
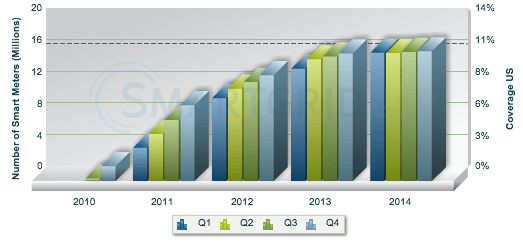
** Number of entities reported: 81
Updated on March 13, 2015
SGIG recipients were also required to submit monthly reports to DOE through SIPRIS that included the number of smart meters they had installed. As of June 30, 2015, the number reported in SIPRIS was 16,340,240. This count may be greater than the number reported in this chart because the numbers reported to SIPRIS may have included meters that have been installed, but were not yet operational or able to transmit the information that they were collecting to the utility (i.e., able to perform their primary function).
( Back to Top )AMI Expenditures
SGIG Program AMI Expenditures
Deployed as of December 31, 2014
Updated March 11, 2015
|
AMI Assets |
Quantity* |
Incurred Cost** |
Number of Entities Reporting*** |
|
AMI smart meters**** |
16,322,970 |
$2,744,872,492 |
81 |
|
Communications networks and hardware that enable two way communications |
|
$585,918,713 |
78 |
|
IT hardware, systems, and applications that enable AMI features and functionalities |
|
$666,314,859 |
75 |
|
Other AMI related costs |
|
$362,052,698 |
105 |
|
Total AMI cost |
|
$4,359,158,762 |
105 |
* In some circumstances, costs were
incurred before devices were installed resulting in a reported cost where the
quantity is zero.
Projects only reported data on devices they planned to install. Each project
installs equipment that best supported their individual goals. Therefore, the
number of projects reporting is expected to vary by equipment category. The
individual project reporting pages show what equipment that project installed.
** All dollar figures are the total cost, which is the sum of the federal investment and cost share of the recipient (the recipient cost share must be at least 50% of the total overall project cost).
*** In some cases the number of entities reporting was greater than the total number of projects funded by the Recovery Act because some projects had multiple sub-projects that reported data. View list of sub-projects.
**** SGIG recipients were also required to submit monthly reports to DOE through SIPRIS that include the number of smart meters they had installed. DOE reports both numbers. The count provided here includes meters that were installed AND functioning (i.e., they were transmitting information to the utility in support of their primary function). The SIPRIS numbers reported the number of meters installed.
Customer Devices Deployed
This chart shows the number of customer devices that had been installed and made operational through the SGIG program. Customer devices are often used with smart meters to provide information that enables customers and utilities to manage energy usage. Customer devices included in the SGIG program:
- In home displays
- Energy management
- Direct load control devices
- Programmable controllable thermostats
- Smart appliances
SGIG Customer Devices Installed and Operational
Deployed as of March 31, 2015
in Thousands of Units
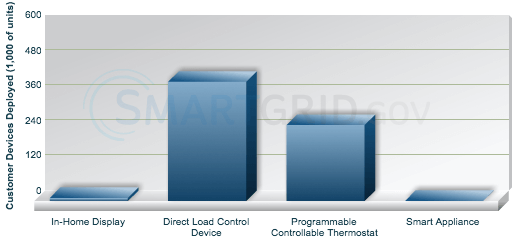
** Number of entities reported: 53
Updated on March 13, 2015
Customer System Asset Expenditures
SGIG Program Customer System Asset Expenditures
Deployed as of December 31, 2014
Updated March 11, 2015
|
Customer System Assets |
Quantity* |
Incurred Cost** |
Number of Entities Reporting*** |
|
In home displays |
10,468 |
$16,724,920 |
28 |
|
Direct load control devices |
407,921 |
$146,408,072 |
40 |
|
Programmable communicating thermostats |
259,836 |
$93,321,376 |
26 |
|
Smart appliances |
292 |
$1,704,679 |
8 |
|
IT hardware, systems, and applications that enable CS features and functionalities |
|
$203,574,688 |
48 |
|
Other customer system related costs |
|
$201,626,518 |
100 |
|
Total customer system cost |
|
$663,360,252 |
100 |
* In some circumstances, costs were
incurred before devices were installed resulting in a reported cost where the
quantity is zero.
Projects only reported data on devices they planned to install. Each
project installed equipment that best supported their individual goals. Therefore,
the number of projects reporting is expected to vary by equipment category. The
individual project reporting pages show what equipment that project installed.
** All dollar figures are the total cost, which is the sum of the federal investment and cost share of the recipient (the recipient cost share must be at least 50% of the total overall project cost).
*** In some cases the number of entities reporting was greater than the total number of projects funded by the Recovery Act because some projects had multiple sub-projects that reported data. View list of sub-projects.
Customers Enrolled in Time-based Rate Programs
The chart below shows the number of customers enrolled in time-based rate programs through the SGIG program.
SGIG Customers with Smart Meters Enrolled in Pricing Programs
Deployed as of December 31, 2014
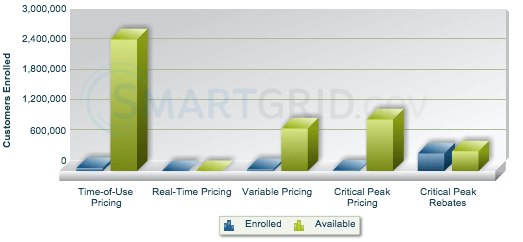
** Number of entities reported: 28
Updated on March 13, 2015
Learn more about time-based rate programs >>
( Back to Top )Projects
The location, information, and data for each smart grid project are provided in this section.Click for Projects
Publications
These reports include analysis, impacts, lessons learned, best practices, analytical tools, and case studies that were supported by the Recovery Act Smart Grid Programs.Click for Publications
